


Adding paths
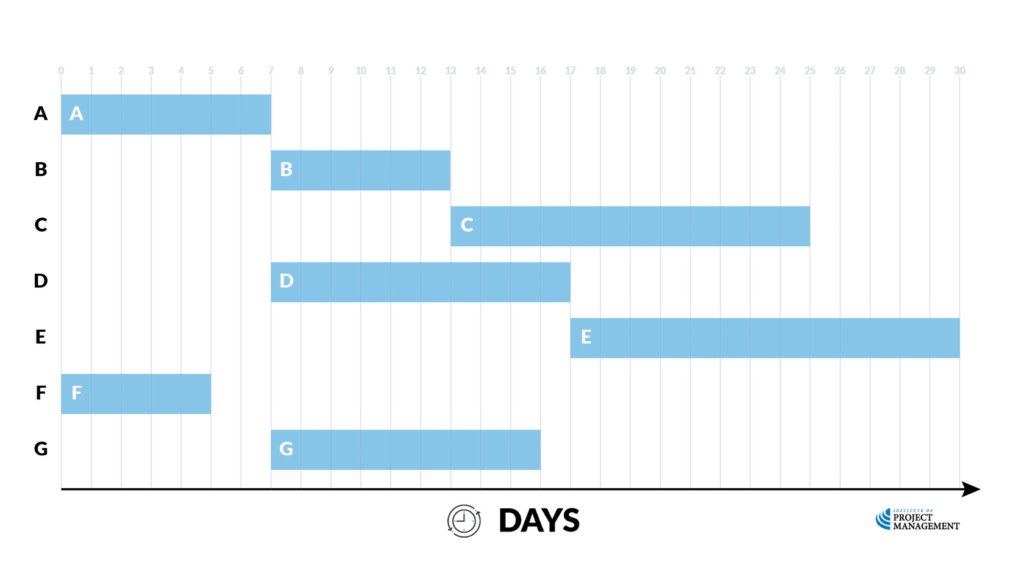
Continuing our example from the previous topic, we can now start to fill our Gantt chart with some more information.
First of all, we can add our float to those tasks that have some. We will also use a different color to illustrate it here.
Task A has no float; however, Task B has a total of 6 days.
Let’s shade that out on our chart – it is no coincidence that the float ends on our late finish date for the task of day 18.
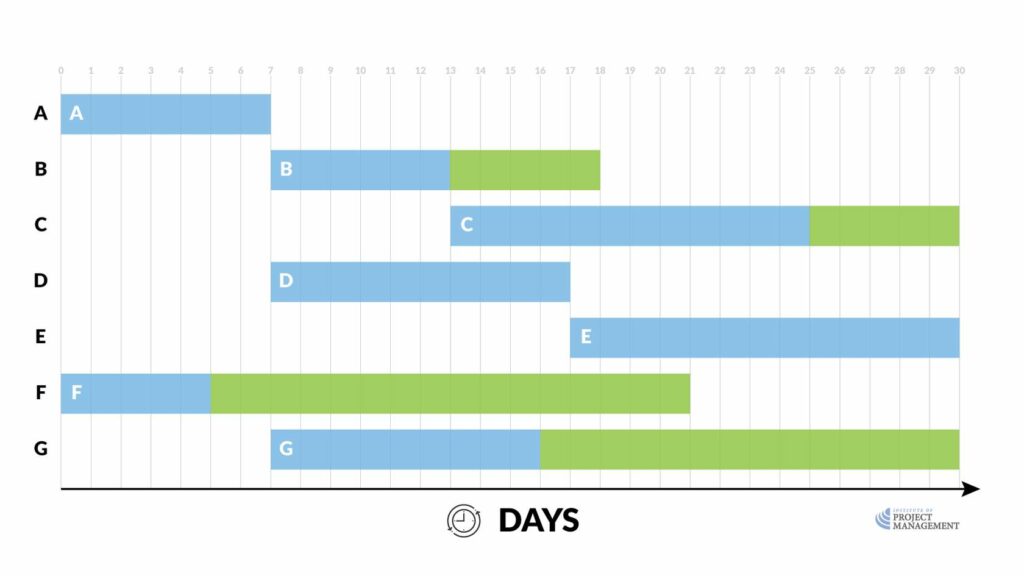
Task C has 5 days of float, which takes it to its late finish of day 30; whereas Tasks D and E have no float because they are on the critical path.
Task F, however, is 16 days, taking us to the late finish of day 21; the 14 days of float attached to Task G will also take us to the end of the project.
From here it is a simple case of adding in dependencies – these are usually inserted as drop-down lines, with the critical path again highlighted in red.
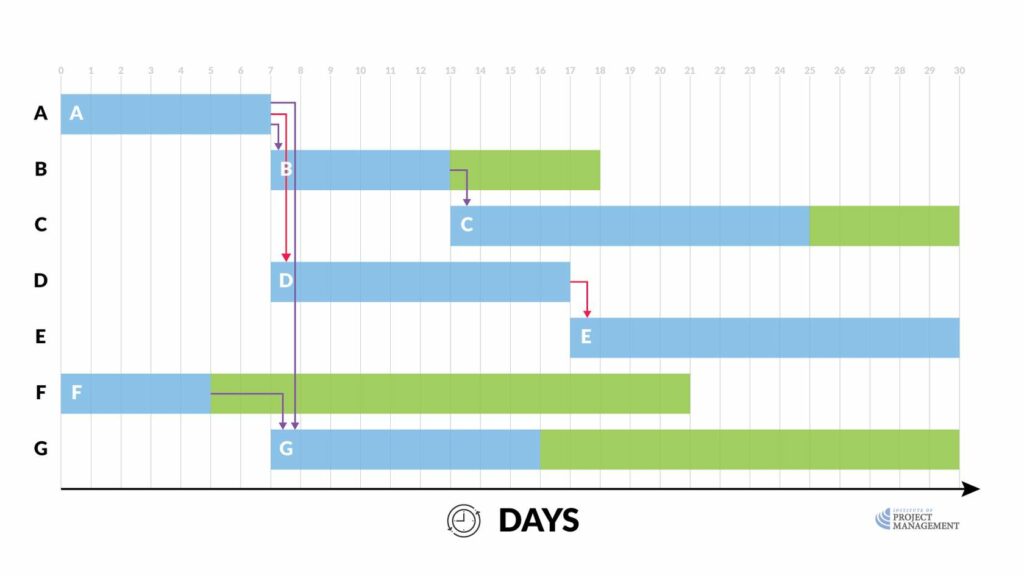
Note that in Gantt charting, the dependency drop-arrow fixes to the planned start date of a task.
This means you cannot tell at a glance if they are finish- or start-to-start.
Pros and cons
Aided by project management software, a Gantt chart is the most recognizable output of the project planning process; however, it is important to note the limitations of this scheduling technique.
A common error made by those who equate Gantt charting with project design is that they attempt to build the WBS at the same time as they map the schedule – project management software actually makes this bad habit very easy to do.
Unfortunately, this practice makes it very difficult to follow the 100% rule introduced earlier.
Remember, the WBS should include 100% of the work defined by the project scope and capture all deliverables – internal, external, and interim – including project management activities.
It is essential that the WBS should be fully (100%) defined before the project schedule is attempted.
And, although a software-aided Gantt chart is useful and valuable for small projects that fit on a single sheet or screen, they can become quite unwieldy for projects with more than about 30 activities.
This points to another benefit of preparing your WBS manually first – by creating a logical hierarchy within tasks – you can more easily categorize and use the twirl features of your project management software to expand and collapse clusters of related tasks.
Moreover, schedule diagrams such as Gantt charts do not represent the size of a project or the relative criticality of tasks; therefore, the magnitude of a behind-schedule condition is easily miscommunicated.
If two work packages are the same number of days behind schedule, the larger task may have a greater impact on resource utilization, something the Gantt chart will not show.
A related criticism is that although project management software can show schedule dependencies as lines between activities, displaying a large number of dependencies may result in a cluttered or unreadable chart – dependency spaghetti as it is sometimes called!
Some people also prefer the visual clarity of a network diagram.
Personally, I find it much easier to follow and communicate the flowchart logic of a network diagram; however, I have trained my brain to intuitively decode a Gantt chart.
This is because Gantt charts, especially in their electronic form, give us much greater control over our schedule, especially when it comes to fine-tuning.
This is something we will explore in more detail in the following few topics.
