


About Gantt charts
These days, most project management software will display the information in the network diagram in a particular form of bar chart known as a Gantt chart.
Initially developed by Polish economist Karol Adamiecki, it was Henry Laurence Gantt, a mechanical engineer and management consultant, who popularised these famous charts in the second decade of the twentieth century.
As a visual tool to show the scheduled and actual progress of work, it was quite a radical concept and an innovation of worldwide importance.
One of the first recorded uses of Gantt charts was for the scheduling of ordinance projects back in the First World War.
The use of this technique was then popularised on large construction projects in the US like the Hoover Dam, which started in 1931, and the interstate highway network which started in 1956.
Since the late twentieth century, with the rise of personal computers, which has coincided with the professionalism of the project management discipline, Gantt charts have become an ubiquitous symbol of project management.
The first Gantt charts were nothing more than a series of tasks on the left-hand side of a big sheet of paper or blackboard, with a calendar of dates running across the top.
All you had to do was mark out a bar to represent the length of time each task was to take and color it in as progress was made.
Milestones were also added to highlight the important elements of a project.
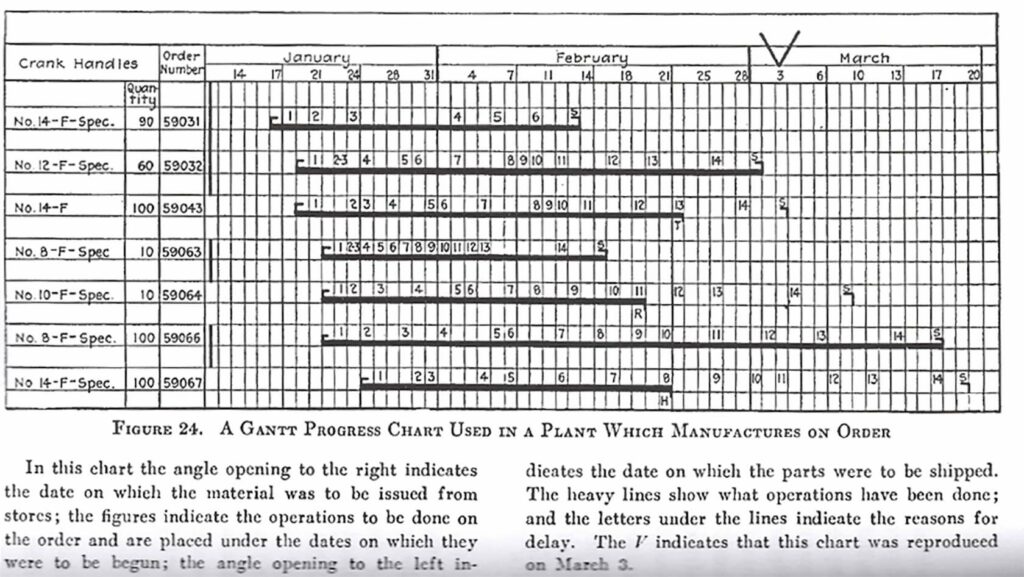
This enabled you to see an estimate of how long the entire project should take, as well as the task and overall project progress.
These fundamental principles remain unchanged by today’s project software – 80% of users still probably don’t use much more than these basic (yet powerful) features.
In the following few lessons, we will look at how to prepare a Gantt chart from the information in our network diagram.
Network diagram to Gantt
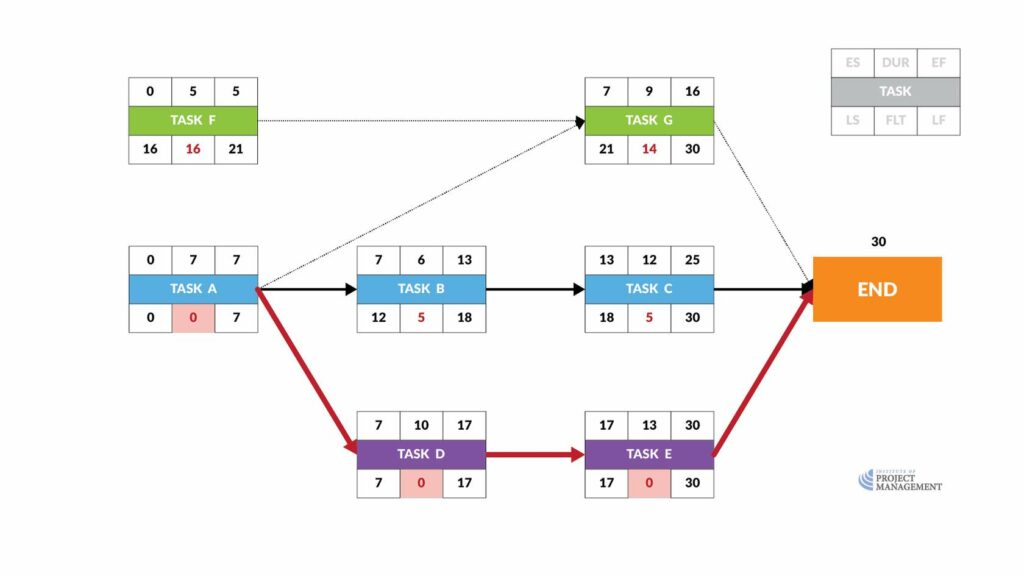
Let’s begin by taking Task A from the last topic and plotting it on our Gantt chart from its early start to its early finish date, the end of day 7.
Task B, now, runs from its early start – the end of day 7, which is really the start of day 8 – for 6 days until the end of day 13; and Task C runs from 8 days to day 25.
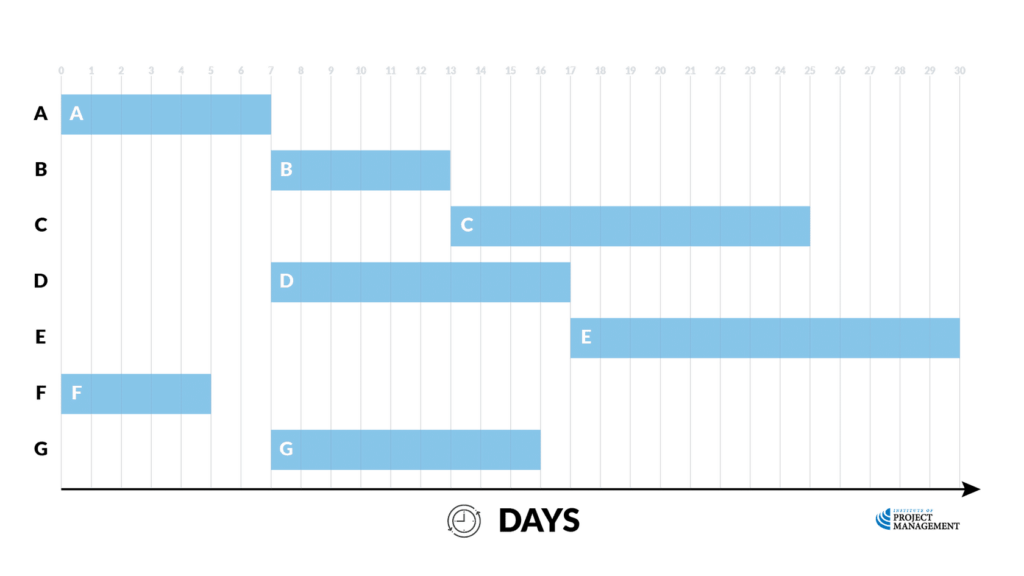
Task D can start at the end of day 7 and run for 10 days to day 17; and it is followed by the 13 days of Task E.
Now, like Task A, Task F can start on day zero, but remember because Task G is dependent on both Task A and Task F finishing before it can start, it must start at the end of day 7 before it can run its 9-day course.
And there you have it – a basic Gantt chart!
