


Why it matters
It is all too easy to skip straight from a good idea to a project.
After all, good ideas often come to us as well-formed project solutions.
For example, we might know that the best way to recognize and reward high-performing project managers is to give them a cash bonus.
Yet, is this really the best way to achieve our intended outcomes – outcomes we defined in our project concept canvas?
Is it the most cost-effective solution? And if it is, how do we know?
How do we prove it?
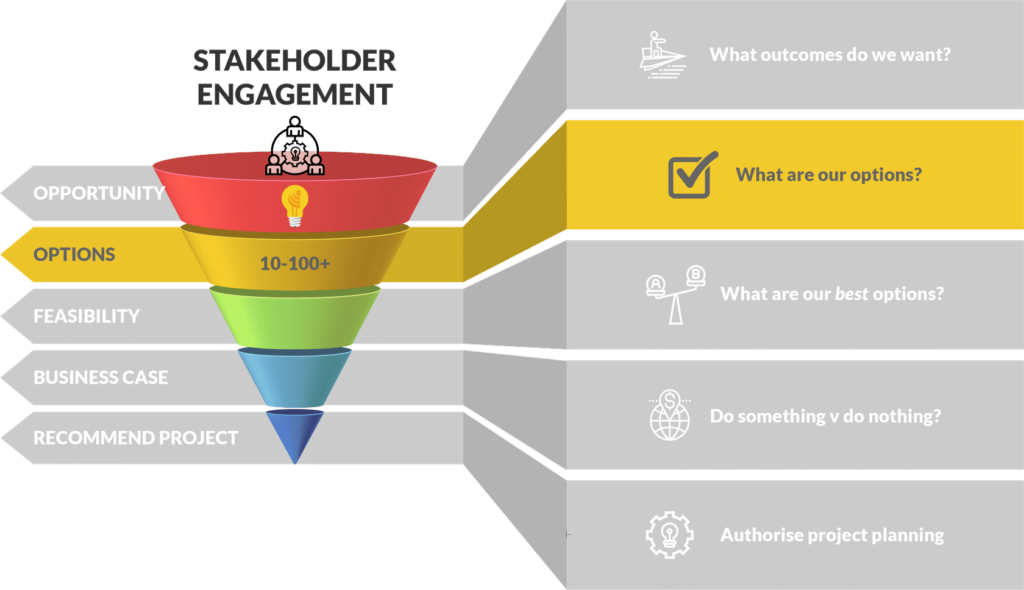
Before we start digging holes, writing code, or booking talent, our project solution needs to be critically evaluated against a range of options.
It is also arrogant to assume that yours is the only mind that can turn to this problem. Given the same time and money, someone else may arrive at a more elegant solution.
And even if they don’t, they may believe their solution is better, unless you can prove otherwise.
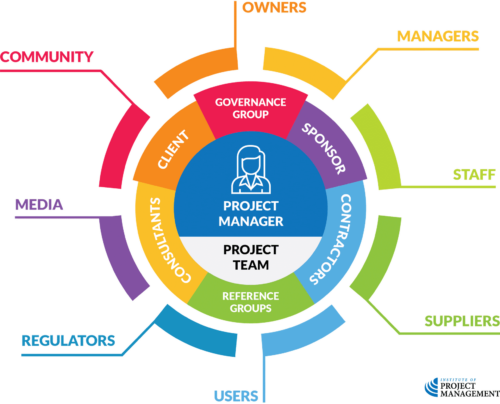
This is why we engage our community of stakeholders as early as possible in a project’s life.
Remember what we said earlier: the cost of change increases significantly the further you get into a project.
Discovering when a project is half-built that there was a better way to achieve our outcomes is not only embarrassing but expensive.
Even when acting under a contract for services or just following the boss’s direction, you should always aim to identify and consider a range of options that maximize the project’s potential benefits.
For example…
Suppose our grand idea is to give every high-performing project manager in our organization a cash bonus.
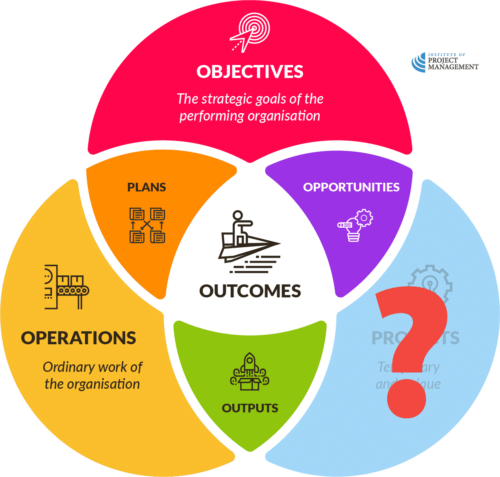
The cash bonus will be our proposed project’s output (or deliverable), but what are we trying to achieve here?
As we saw in our concept canvas, the actual outcome we are aiming for is to incentivize our teams to be more productive.
This should fulfill our corporate objective of having a more productive workforce.
So, is there another way to achieve the same outcome?
Well, if all we want to do is incentivize project managers to be more productive, we could instead:
- Give them an additional week of paid leave
- Take them on a corporate team-building day
- Host a project management awards night
- Make a charitable donation in their name
- Send them and their families to Richard Branson’s Island for a holiday
And within these options are many additional project possibilities:
- Do we award the top 5%, 10%, or 20% of project managers?
- What do we mean by ‘high performance’? Is it performance against the project plan, peer votes, client satisfaction, or something else?
- Do we deliver the project in-house or outsource it to experts?
For every outcome – and each opportunity will have multiple intended outcomes – there can be literally hundreds of (project) paths to completion.
Thinking creatively
Suppose our grand idea is to give every high-performing project manager in our organization a cash bonus.
If we are insufficiently creative, we might miss genuine opportunities to save time and money or add value. In contrast, if we are not critical enough, we can waste effort or increase the risk of (expensive) errors.
Creative thinking is the process of generating and organizing our ideas (options) in a meaningful way that can be acted on.
Let’s look first at different ways we can creatively generate ideas.
Free brainstorming
Brainstorming is a technique used to generate and collect multiple ideas, often simultaneously.
In this case, efforts are made to find optional responses to our opportunity by gathering a list of ideas spontaneously contributed by participating stakeholders.
The four rules of brainstorming credited to Alex Osborn are:
- generate as many ideas as possible
- prioritize unusual or original ideas
- combine and refine the ideas generated, and
- abstain from criticism during the exercise.
Effective brainstorming therefore requires good facilitation, something we will consider in more detail in the next Unit on project communication.
Structured brainstorming
Structured approaches enhance brainstorming by requiring stakeholders to write down their ideas silently and independently before small group, and then whole of team, discussions (also known as the nominal group technique).
Not only does this approach increase the number of options generated by the group, but it is also a particularly useful response to the limitations of free brainstorming that Tomas Chamorro-Premuzic highlights, which include:
- Social loafing: The tendency – also known as free riding – for people to make less effort when working in teams than alone. As with the bystander effect, we feel less compelled to do something when we know other people might do it.
- Social anxiety: People worry about other team members’ views of their ideas. This is also referred to as evaluation apprehension. Similarly, when team members perceive that others have more expertise, their performance declines. This is especially problematic for introverted and less confident individuals.
- Regression to the mean: This is the process of downward adjustment whereby the most talented group members match the performance of their less talented counterparts. This effect is well known in sports – if you practice with someone less competent than you, your competence level declines, and you sink to the mediocrity of your opponent.
- Production blocking: No matter how large the group, individuals can only express a single idea at a time if they want other group members to hear them. Studies have found that the number of suggestions plateaus with more than six or seven group members, and the number of ideas per person declines as group size increases.
Delphi technique
The Delphi technique lends itself more to an offline process, when stakeholders cannot all be in the same room.
It invites a selected group of experts to answer a series of targeted questions in two or more rounds; for example, ‘How can we deliver this outcome?’
After each round, a facilitator provides an anonymous summary of the experts’ responses together with the reasons they provided for their judgments, and further comment is invited.
Thus, experts are encouraged to revise their earlier answers in light of the replies of other panel members.
It is believed that during this process, the range of the answers will decrease, and the group will converge towards the ‘correct’ answer.
All of these techniques emphasize direct stakeholder consultation as our primary source of ideas and information.
It is nonetheless important that we do not overlook secondary sources of data, such as industry publications, authoritative reports, cases, reviews of like projects, and good old Google to inform our decision-making.
The chances are that someone out there has solved this problem before you, and you should look to benefit from their experience, even (or especially) when they are not part of your circle of immediate stakeholders.
Organizing ideas
As part of the creative thinking process, it is important to allow participants to pause and reflect on stakeholder efforts so far.
To the extent that this is possible, you should try to visually represent progress.
Mind map
Mind mapping converts ideas created through individual brainstorming into a single map to reflect commonality and differences in understanding, and generate new ideas.
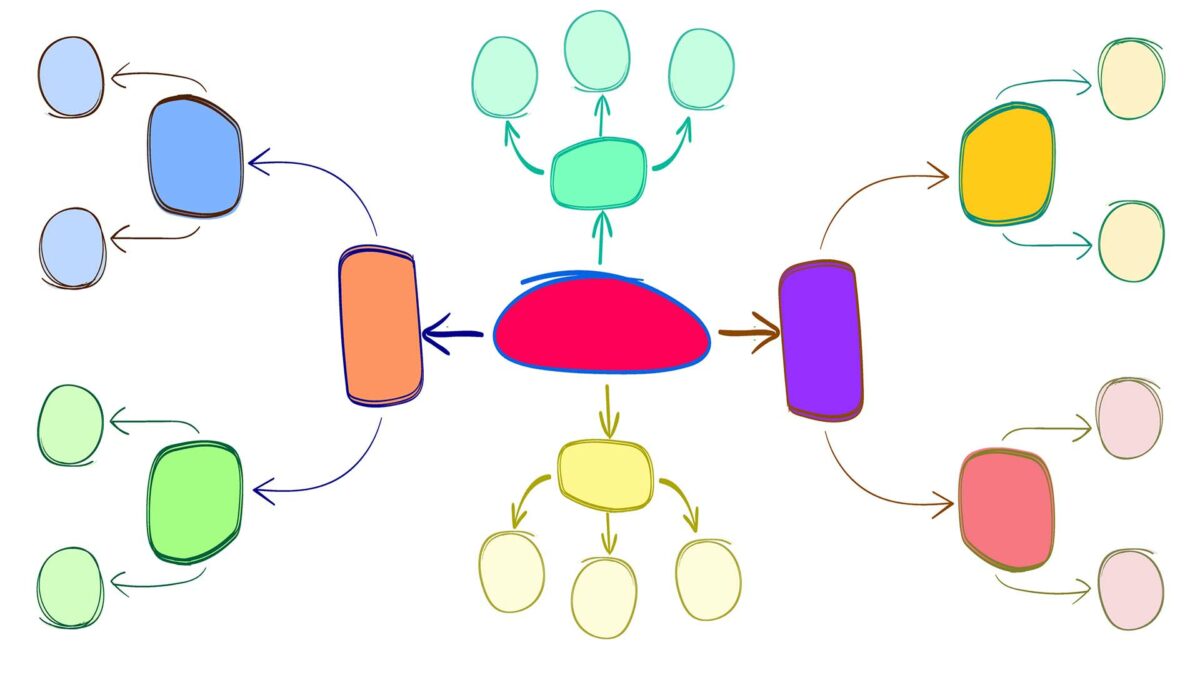
A mind map is often created around a single word or text, placed in the center, to which associated ideas, words, and concepts are added.
Major categories radiate from a central node, and lesser categories are sub-branches of larger branches.
Categories can represent words, ideas, tasks, or other items related to a central keyword or idea.
We will show you how to develop and use a mind map in the Unit on managing project risk.
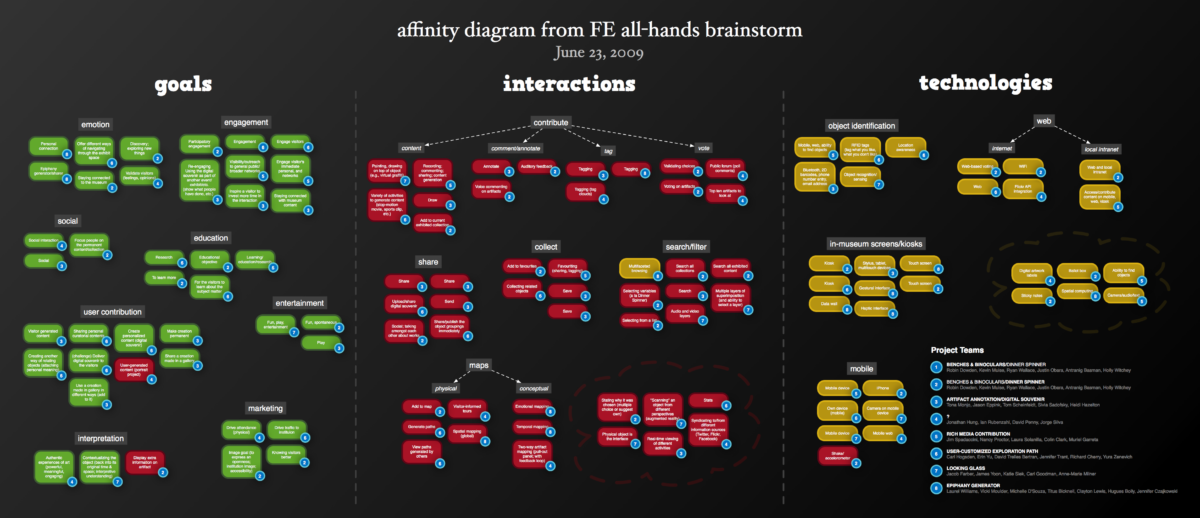
Affinity diagram
The affinity diagram is another tool used to organize ideas and data.
It is commonly used in project management to allow large numbers of ideas stemming from brainstorming to be sorted into groups, based on their natural relationships, for review and analysis.
For example, we often use an affinity diagram to illustrate relationships in a work breakdown structure (coming soon!) or an organizational chart.
It is also frequently used to organize notes and insights from our various stakeholder engagements.
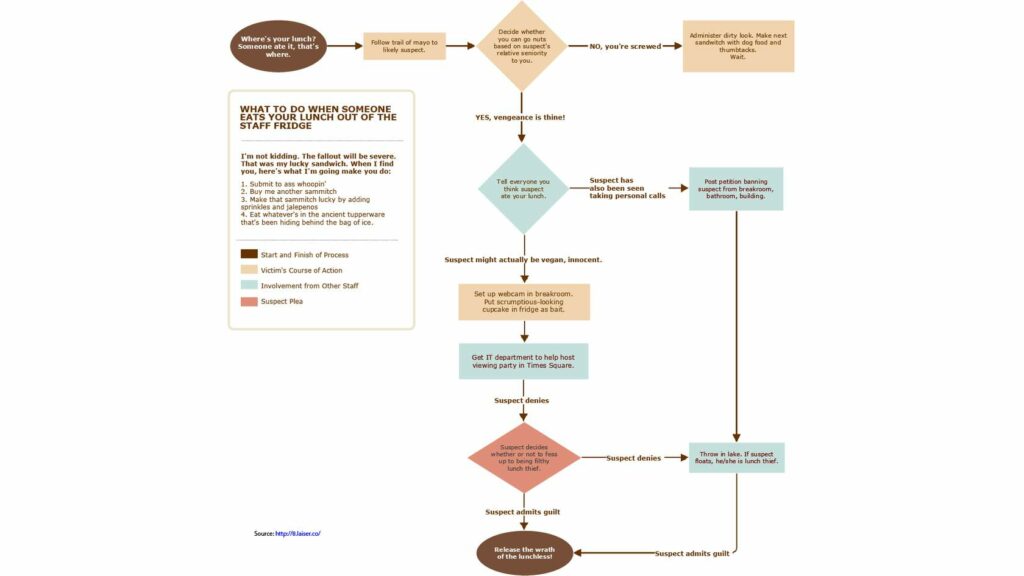
Flowchart
A flowchart is a type of diagram that represents an algorithm, workflow or process, showing the steps as boxes of various kinds, and their order by connecting them with arrows.
This diagrammatic representation illustrates a solution model to a given problem.
Flowcharts are used in analysing, designing, documenting or managing a process or program.
A project’s schedule can also be represented in a flowchart to highlight task dependencies and the critical path, concepts we will introduce in the next Module.
In the next topic, we will introduce ways to think critically about the options you have generated.
