


Network diagramming
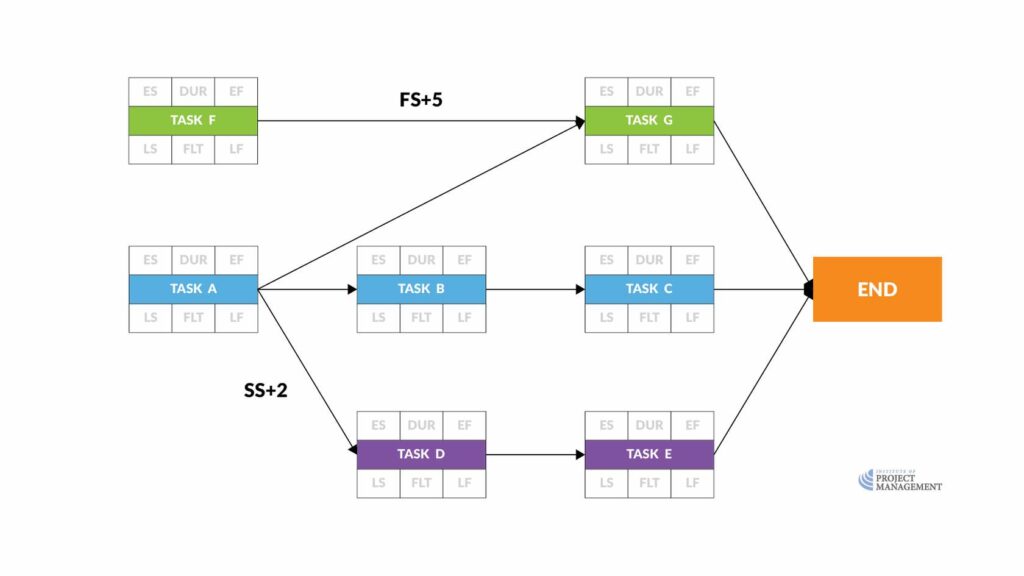
The Precedence Diagramming Method (PDM) uses boxes – called nodes – to represent activities, and connects them with arrows to show dependent relationships.
This highly visual process of dependency mapping allows us to organize the WBS by sequence.
This technique is also called Activity-On-Node (AON), or more simply, network diagramming.
When manually preparing a network diagram you can use your WBS task sticky notes as nodes, placing them on a larger sheet of paper to draw in the dependent relationships.
Starting with our estimated time to complete (or task duration (DUR)), we can use our network diagram to calculate values for the fields that surround each task, namely:
- The earliest we can start each task (ES)
- The earliest we can finish each task (EF)
- The latest we can start each task (LS)
- The latest we can finish each task (LF)
- How much float (or slack) we have on each task (FLT), and
- The project’s critical path.
For the sake of convenience, we will also remove the leads and lags marked in the example above – they are shown here for illustrative purposes only.
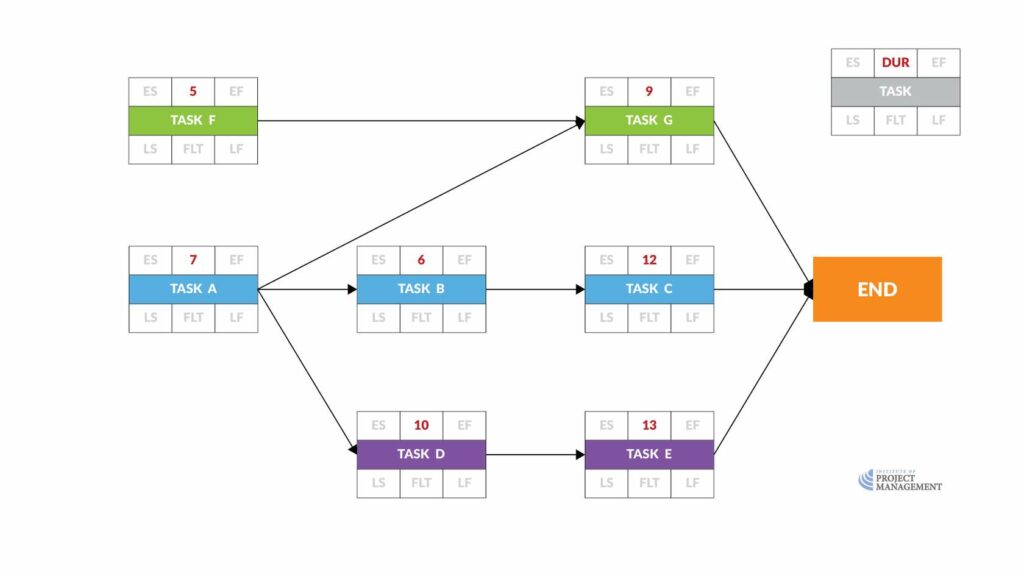
Activity durations
As part of our requirements analysis, we estimated the time to complete each task.
Having laid out our tasks by dependency in a network diagram – a process called sequencing – we can now add in those estimates of task duration.

In this project, we estimate that:
- Task A will take 7 days
- Task B will take 6 days
- Task C will take 12 days
- Task D will take 10 days
- Task E will take 13 days
- Task F will take 5 days
- Task G will take 9 days
There is a standard protocol for where you place each number on a node for reasons that will soon become clear.
For now, make sure your estimate of activity duration is centered immediately above each task node.
Early start and finish
Now we can take what is called a forward pass through the network to determine the early start and finish dates for each activity.
From here on, we use the ‘end of day’ as our point for determining and recording early and late start and finish values.
Therefore the start of Day 1 is recorded as the end of Day Zero.
The start of Day 8 is recorded as the end of Day 7.
You will see that this makes our calculations easier as we move through the forward and backward passes.
The earliest day Task A can start is (the end of) Day Zero.
As it will take 7 days to complete, this means that the earliest it can finish is (the end of) Day 7.
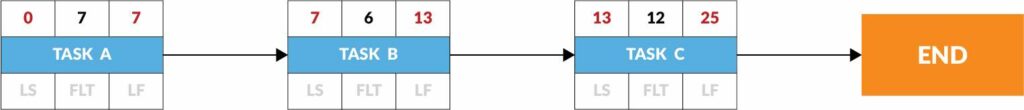
Therefore, the earliest day that Task B can begin is Day 7.
Given its estimated duration of 6 days, the earliest it can finish is Day 13.
Task C gives us an early start on Day 13, and an early finish on Day 25.
The earliest a task can finish is calculated by adding the activity duration to the early start date: ES + DUR = EF.
You will see that Task D cannot start until Task A is complete, so like Task B, the earliest it can start is Day 7.
As Task D is expected to take 10 days, the earliest it can be finished is Day 17.
Therefore, the early start and finish dates of Task E will be 17 and 30 days, respectively.
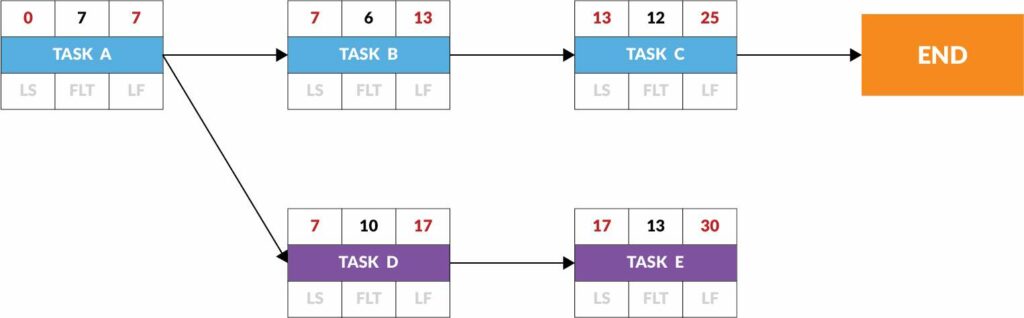
Like Task A, Task F has no predecessor tasks, so it can begin on Day Zero and finish on Day 5.
Task G has two predecessor activities: Tasks F and A.
Because it cannot start until both Task A and Task F are finished, Task G cannot actually start until Day 7.
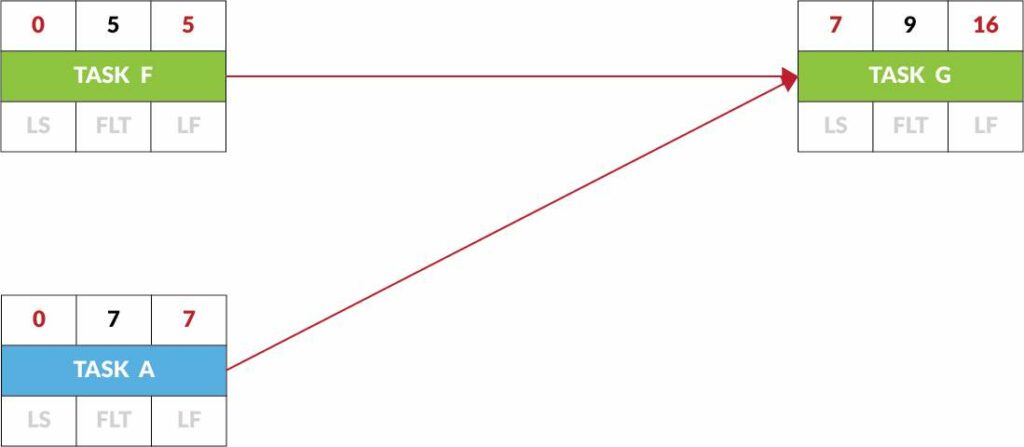
Task G cannot start on Day 5, because it is still waiting for Task A to complete.
Therefore, Task G must start on the early finish date of Task A, the later of the two, predecessor, early finish dates.
By that same logic, the earliest our project can finish is Day 30 – the latest of the predecessors’ early finish dates.
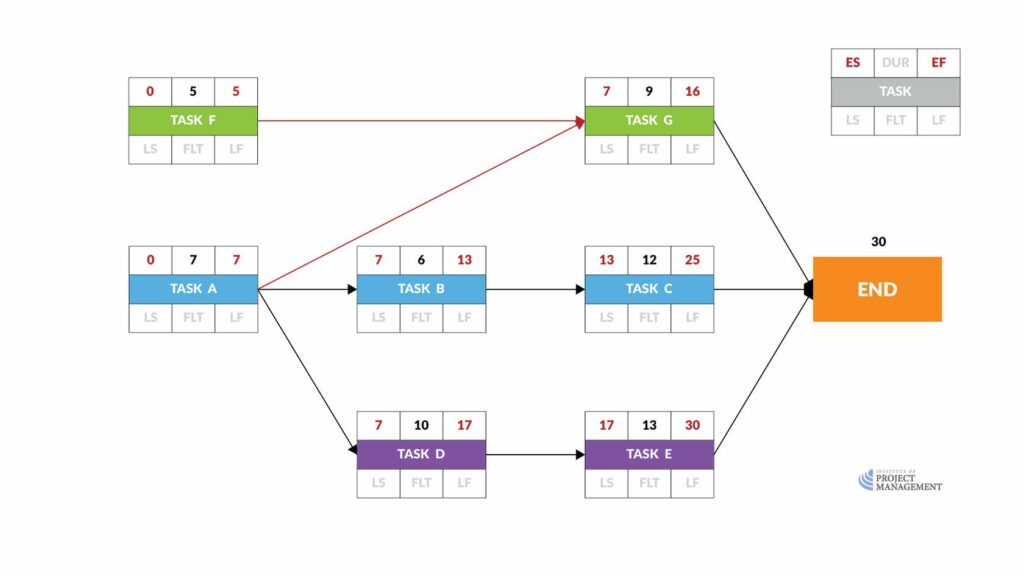
Once again, we are placing the early start and early finish dates at the top of each node, on the left- and right-hand sides, respectively.
