


CPI & SPI
Some of you who regularly work with numbers may have already recognized that we can convert our measures of cost and schedule variance into percentages.
This will allow us to better communicate the relative performance of the project against schedule and budget.
After all, a $1,000 variance on a $4,000 project is significant; however, a $1,000 variance on a $400,000 project is not worth getting too upset about.
This is why we, more often than not, convert our cost and schedule variances into performance indices.
The method for doing so is laughably simple:
Cost variance = CV = EV – AC
Cost performance index = CPI = EV ÷ AC
Schedule variance = SV = EV – PV
Schedule performance index = SPI = EV ÷ PV
See what we did there?
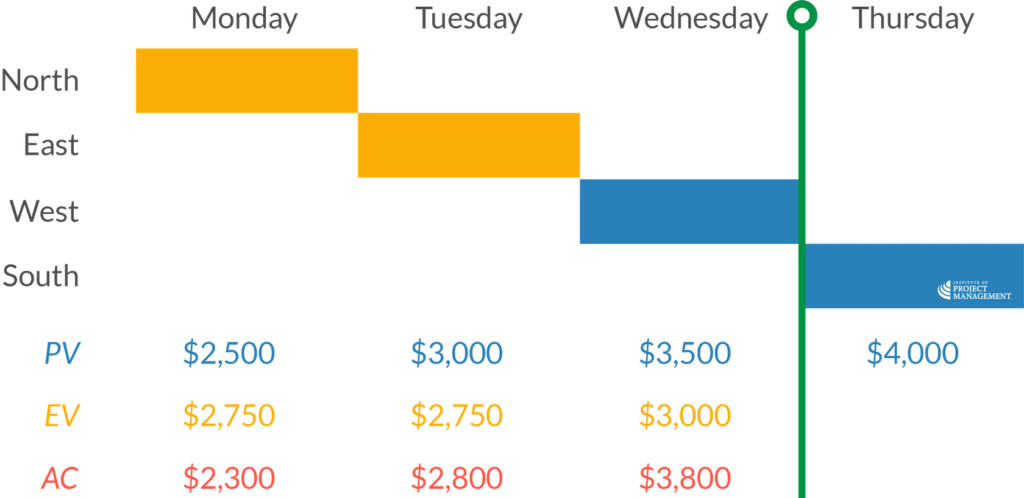
Let’s work out the Monday and Wednesday cost and schedule performance indices for our example project.

The Monday CPI is $2,750 (EV) divided by $2,300 (AC), or 1.20
The Monday SPI is $2,750 (EV) divided by $2,500 (PV), or 1.10
This means that, as of Monday, we were 20% under budget and 10% ahead of schedule.
- The Wednesday CPI = $3,000 (EV) ÷ $3,800 (AC) = 0.79
- The Wednesday SPI = $3,000 (EV) ÷ $3,500 (PV) = 0.86
In other words, as of Wednesday, we are 21% over budget and 14% behind schedule.
Note that using our measures of time (such as half a day ahead of schedule) doesn’t work here, as time is not calculated using base-10 mathematics: if you are so inclined, try it, and you will see what I mean.
Benchmarking
To summarise…
The Wednesday CPI = $3,000 (EV) ÷ $3,800 (AC) = 0.79
The Wednesday SPI = $3,000 (EV) ÷ $3,500 (PV) = 0.86
As of Wednesday, we are 21% over budget and 14% behind schedule.
Looking at these figures, the budget situation is worse than the schedule situation, so that should probably demand our more immediate attention.
You couldn’t tell that, though, just by looking at the updated Gantt chart!
You may also have observed the following about cost and schedule performance indices.
- In as much as a cost or schedule variance of zero means that a project is being delivered perfectly to plan, a CPI or SPI of one means the same thing.
- CPI and SPI results greater than one are a good thing, indicating that we are ahead of schedule or under budget
- A CPI or SPI less than one suggests trouble ahead – we are either behind schedule or over budget.
Importantly, performance indices are not just useful for tracking progress within projects; they are also a valuable benchmarking tool when comparing the performance of multiple projects across programs and portfolios of work.
After all, how else might you compare the performance of a six-month project with a $50,000 budget against a two-year project with a $20,000,000 budget?
Control limits
Order of magnitude is also much more critical with CPI and SPI – the further we get from one (either above or below), the better or worse our project is doing.
That is why we might place control limits (or tolerances) on our indices.
For example, it might be an organizational policy that if CPI drops below 10%, then it is mandatory that the steering committee is notified and a remedial action plan forwarded.
Control limits are most effectively illustrated using our EVM chart.
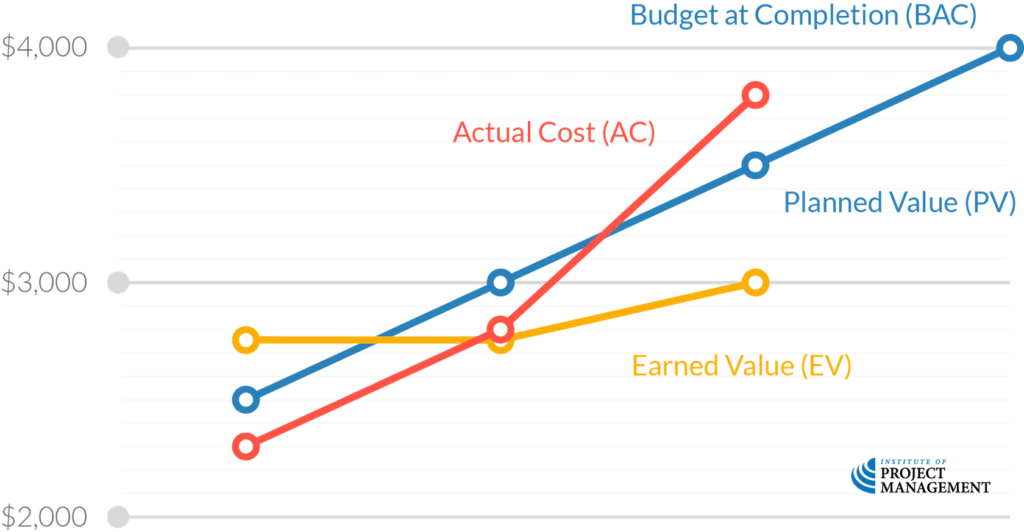
Our continuing example shows that on Wednesday, our actual costs exceeded our earned value by 21%.
This is outside our tolerated variance of 10%, our organizational trigger to take action.
And even though our cost differential on Monday was in our favor (+20%), that might still be a trigger to ask why our original estimates were so far out.
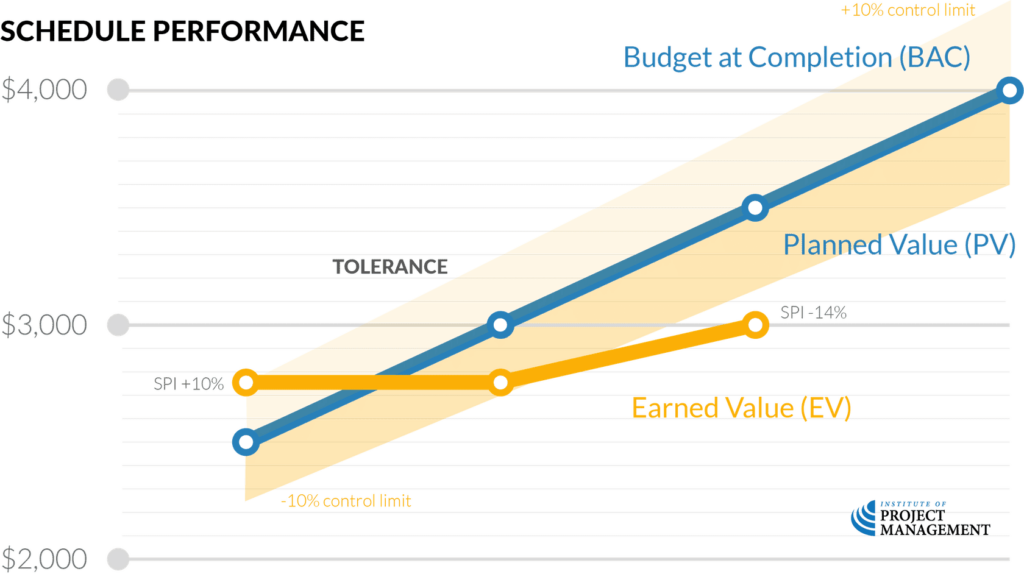
Similarly, on Monday, our schedule performance was within specification (or ‘spec’ – another word for tolerance).
However, by Wednesday, our control limit of ±10% had been broken, so our sponsor should be notified.
