


Updating progress
If I am your manager, I need to see more than just the overall health of the project.
I also want to see where we are against certain milestones so that I can decide whether or not to get more involved.
One of the hardest things a sponsor has to do is decide whether to give you more room or lend you a hand; whereas we don’t want to carry your work for you, we also don’t want you to fall flat on your face.
Our old friend, the Gantt chart, is once again helpful in this regard – it lets us:
- see your task performance at a high level
- determine if the schedule is acceptable as it stands, and
- predict pitfalls you might face down the road.
Cast your mind back to the example Gantt chart we looked at in the planning module.
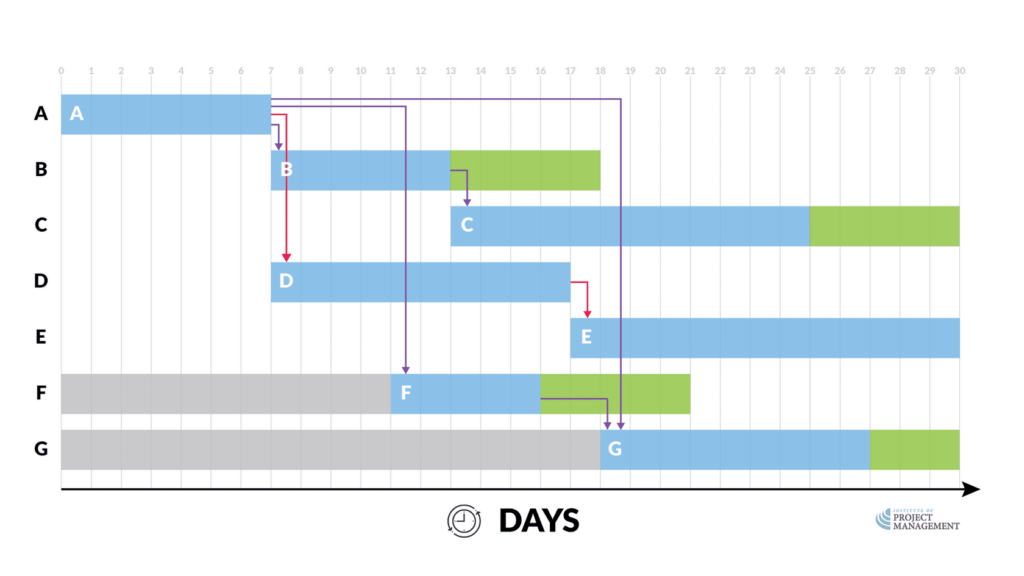
Now we can monitor and control our project schedule by updating the Gantt chart with the project’s progress.
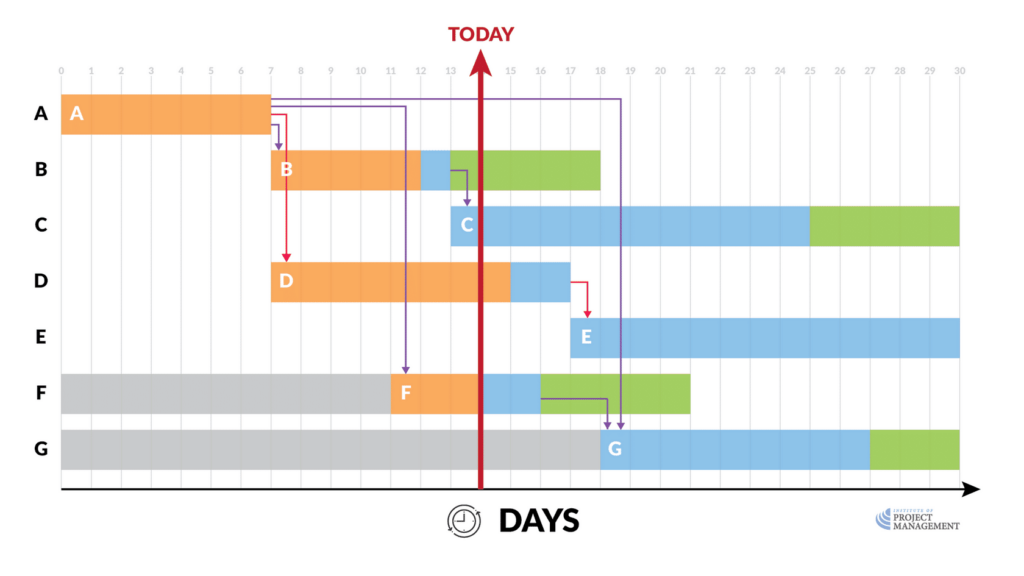
On this chart, we have added a red line at the end of day 14 to show the real-time elapsed.
If the orange block indicates work completed, we can see that Task A is complete.
Task B is one day behind schedule, and this is what has probably delayed the start of Task C by at least a day.

Now, because there is float on this path (B to C), this may not prevent us from completing the project on time, but remember the exponential effect of task slippage on the available float!
You, as the project manager, should therefore start to take an active interest in this delay.
As you can see, Task D is ahead of schedule, which is fantastic news, because this task is on the project’s critical path (red line – no float), meaning Task E should start on time at the very least.
Task F is also on schedule, which is encouraging.
Importantly, though, there are several things that this chart is not telling us, so we should be careful that we don’t assume too much from it.
What it doesn’t say
Firstly, although Task A is complete, it does not tell us when the work was completed.
This is important, as it is possible that Task A finished as late day as 10, and the owner of Task B has made a heroic effort to recover as much lost time as she has!
Similarly, we have no clues about how we are performing against budget.
Task D might be ahead of schedule, but if we have already spent twice the amount of money allocated to it, this could mean there is no cash left for Task G, which is yet to begin!
An updated Gantt chart only tells us what is wrong with our schedule, and not why things are going wrong.
It is always the responsibility of the project manager to investigate things further if remedial action is needed. To that end at least, tracking progress on our Gantt chart is a valuable exercise.
As a visual aid, it also gives another way to represent high-level information about our project’s performance.
Now if only there was a way to more reliably track schedule and budget performance – oh, and somehow even predict what will happen next…
