


Planning value
Let’s see an example of planned value, earned value, and actual cost in action…
Our project scope is to build a four-sided fence, and the following WBS with schedule has been approved.
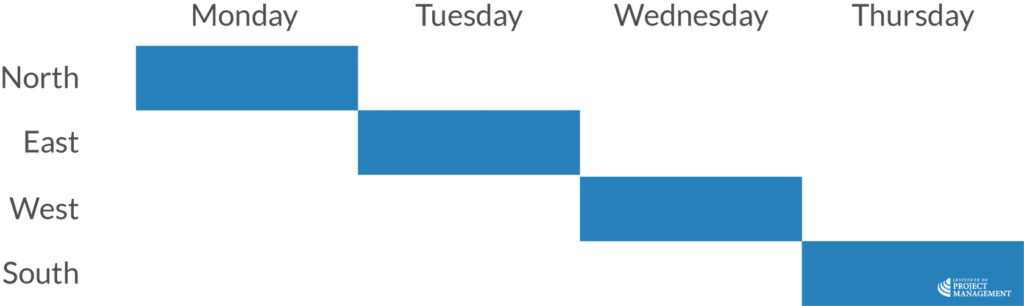
On Monday, we will build the North face, Tuesday, the East face, Wednesday, the West, and Thursday, the South.
As a result of our detailed planning, we have also estimated that it will cost $2,000 in total for materials and $500 per day for labor.
Let’s add that information in…
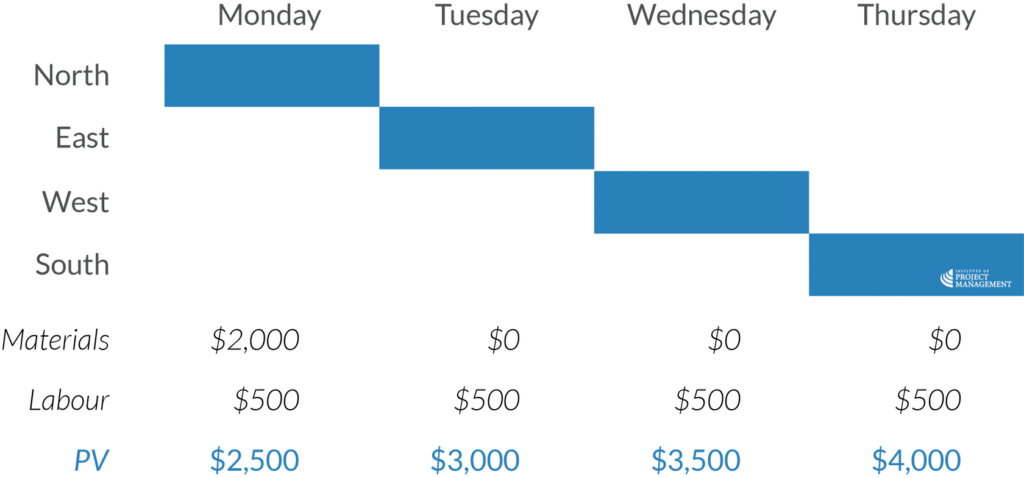
As you can see, the planned value is expressed cumulatively as the project progresses. In other words, we planned to have spent:
- $2,500 by the end of day 1
- $3,000 by the end of day 2
- $3,500 by day 3, and
- $4,000 by the completion of the project.
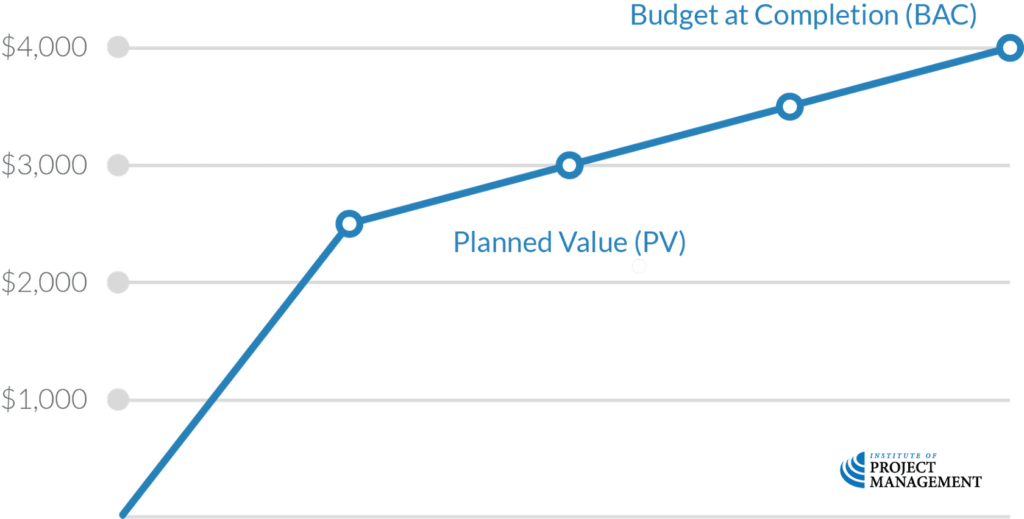
If we were to plot this information on a chart, we would see that the planned value of the project follows a defined trajectory that aligns with this cumulative expression of value.
Earning value
Now, let’s suppose that on Monday, we completed all of the north side of the fence and half of the east side.
We were also able to secure a 10% discount on the materials.
What would our PV, EV and AC be now?
First of all, let’s update our Gantt chart.
Here is where we are now, the end of Monday (the green line); and here is the work we have completed (the yellow blocks).
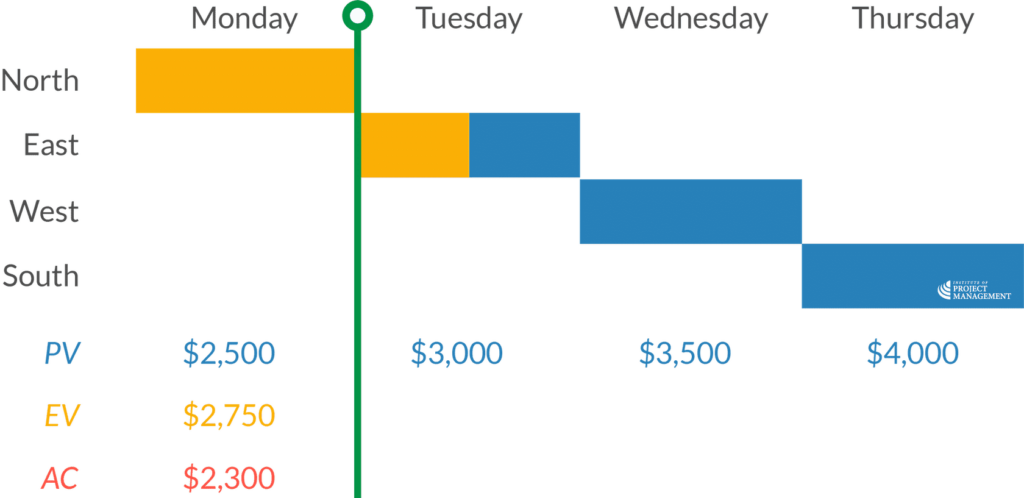
Our planned value does not change – this is our baseline figure.
We have nevertheless earned $2,750 worth of value.
Do you see where that has come from?
We have completed the work we planned for Monday, which was valued at $2,500, and we have also completed half the work we planned for Tuesday.
The planned value of Tuesday’s work was $250, so adding this to the work completed on Monday gives us a total earned value of $2,750.
Our actual costs, however, are different again.
Remember, we received a 10% discount on our materials, so we only actually spent $1,800 on them.
We also only paid for one day’s labor – even though we got one-and-a-half days’ work done – so our actual cost of labor was $500.
$1,800 plus $500 gives us an actual cost at the end of Monday of $2,300.
Maybe use the company credit card instead…
Our EVM chart can also be updated accordingly:
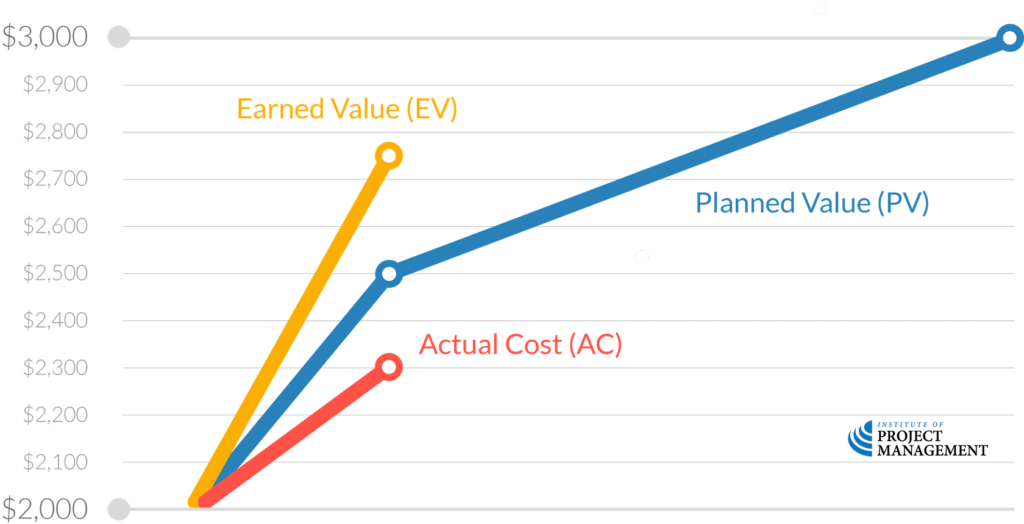
Note that the Y-axis of this graph has been scaled down for illustrative effect.
Make sure you can fully follow this example before moving on, as these numbers will also inform the following topics.
