


Financial costs and impacts
Every project ‘costs’ an organization in three ways.
- Project (output) costs
- Ownership (outcome) costs
- Opportunity costs
Project costs are estimated by asking, ‘How much will it cost to deliver this project?’
In other words, it estimates all the costs of delivering the project’s output(s).
Ownership costs estimate the ongoing operational expense to the client organization of maintaining these outputs once the project is finished.
Another way to look at them is as the price of realizing project outcomes.
Even though these costs are often offset by a revenue stream, it should be accepted that public or not-for-profit projects usually run at a financial loss.
Opportunity costs are a theoretical acknowledgment that by investing in a project, we are foregoing the potential to re-invest in business-as-usual (the default next best option) and enjoying the ordinary profit this re-investment might bring.
Let’s look at each of these costs – and their relationship to each other – in the following few lessons.
Project (output) costs
Our first task in preparing a business case is to estimate the cost to deliver the outputs of each project option.
In the business case – where we are only comparing the relative merit of each option – it is sufficient to estimate these costs at the business case level to within ±20%.
To ensure you broadly capture all the likely project costs in your estimate, you might use the following high-level cost classifications.
Equipment
Equipment costs include all the resources partially used (depreciated) by the project and returned to the organization once the project is complete.
Also sometimes called capital costs, these might include land, buildings, motor vehicles, computers and the like that, from an accounting point of view, appear on the balance sheet as assets.
Materials
Materials are goods wholly consumed by the project, such as concrete, timber, hire goods and the like.
These appear in our financial statements as an expense.
Labor
You must also allow for the project team’s wages, salaries, and on-costs (such as holiday and sick leave), including contractors and consultants.
You should also include any travel and accommodation the project requires in this category.
Transfers
Transfer costs are incurred in taking the project live; in other words, transferring the output(s) from the project team to the client.
These might include user documentation, training manuals, and client walk-throughs.
Because they arrive at the end of the project’s life, it is essential to quarantine these costs in the project’s budget.
This will ensure their allocation doesn’t get spent solving problems earlier in the project’s life.
When we prepare the detailed project budget later in the planning phase, the activities associated with transfer should become a discrete task (or set of tasks).
Indirect costs
Indirect costs accrue over multiple project tasks (or the whole project).
Indirect costs might also describe how much the performing organization subsidizes project delivery.
As such, they might include:
- Project administration costs
- Management or PMO overheads
- Office space, such as the relevant percentage of rent, power, and water
- Office supplies, such as pens, paper, and photocopying
- Communications, such as phones and IT infrastructure, and
- Insurances and taxes.
Indirect costs are particularly relevant for business case decision-making if the indirect costs of one or more options are significantly different.
Note that the project costs for the ‘do nothing’ option always equal zero because when we do nothing, no project is being delivered!
Being cost-free, ‘do nothing,’ therefore, has a default advantage over the ‘do something’ project options – it means the value returned by the preferred project must offset this!
Ownership (outcome) costs
The total cost of ownership (TCO) refers to expenses the client organization will incur post-project delivery.
They are also known as outcome costs.
For project outputs that are delivered or sold on to an external client, ownership costs are usually limited to service agreements and warranty claims.
For project outputs that are retained by the performing organization, such as new machinery, networks, or infrastructure, operating (or ongoing) TCOs might include:
- Infrastructure (such as rent, power, telecommunications, and water)
- Operating labour
- Raw materials
- Routine maintenance
- Interfaces (such as network connections or ongoing policy alignment)
- Insurance and compliance costs
These are often annual costs that are multiplied by the number of years the project solution will remain in place (the project output’s useful life).
Occasional (or strategic) TCOs that could also be reasonably (if less reliably) forecast include:
- New user training
- Major repairs and upgrades, and
- Decommissioning costs.
Strategic TCOs are sometimes called ‘lumpy’ in that their occasional, ad hoc occurrence means they cannot be smoothly apportioned over the life of a project.
It is also important to note that operating and strategic TCOs may increase over time as the solution deteriorates.
Strategic TCOs are added to operating TCOs to estimate the total cost of ownership.
Useful life analysis
In the business case, analysis of the total ownership costs also allows us to compare options with different useful lives (for example, five versus ten years) and options with varying costs of operating (for example, two versus five users to do the same task).
For example, in the following scenario, Option A has a useful life of two (2) years, and Option B has a useful life of four (4) years.
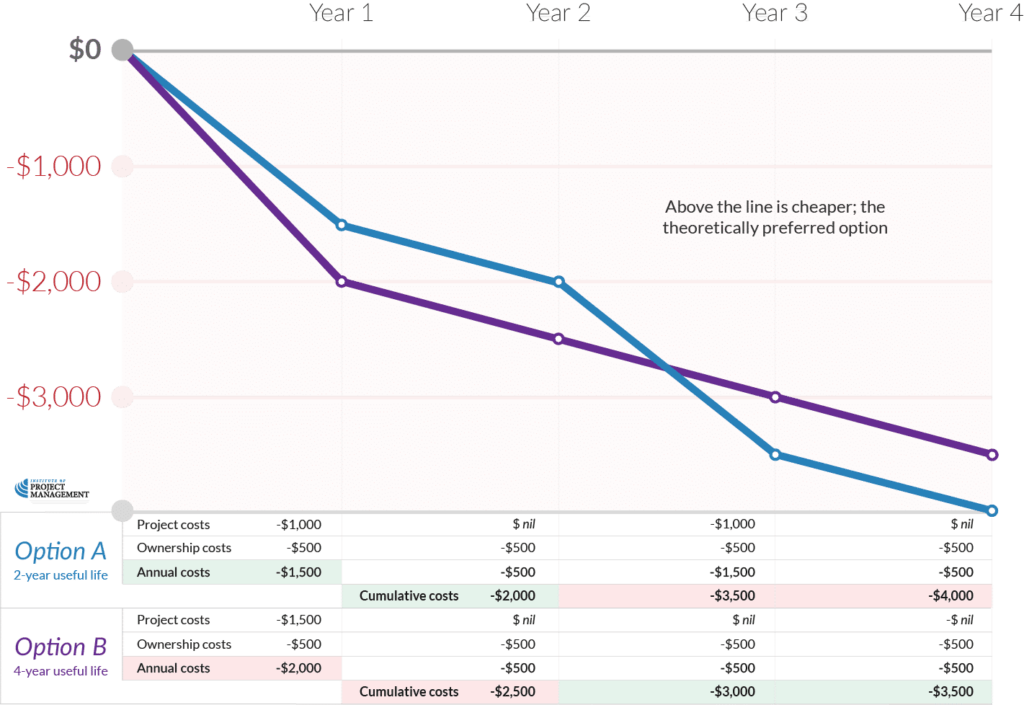
In this example, Option A and Option B have the same ownership costs of $500 per year.
If we only need our project outputs to last for two years, then Option A is going to be cheaper; however, if we need our outputs to last for four years, then Option B should be preferred.
Note, too, that whereas the ‘do nothing’ option has no project costs (because there is no project output), its TCOs may be quite prohibitive!
Net financial impact
Net financial impact is the impact (positive or negative) that a project ultimately has on our balance sheet.
In commercial terms, it is the profit or loss an organization makes on its investment in a project.
The net financial impact of a project can be calculated as follows:
Project revenue – (project + ownership costs)
Continuing our example from the previous lesson, let’s suppose our two Options (A and B) each return $1,500 in annual income once the project is delivered.
However, because the project takes six months to deliver, we can only receive half the income ($750) in any project delivery year.
Our projected cash flow now looks like this:
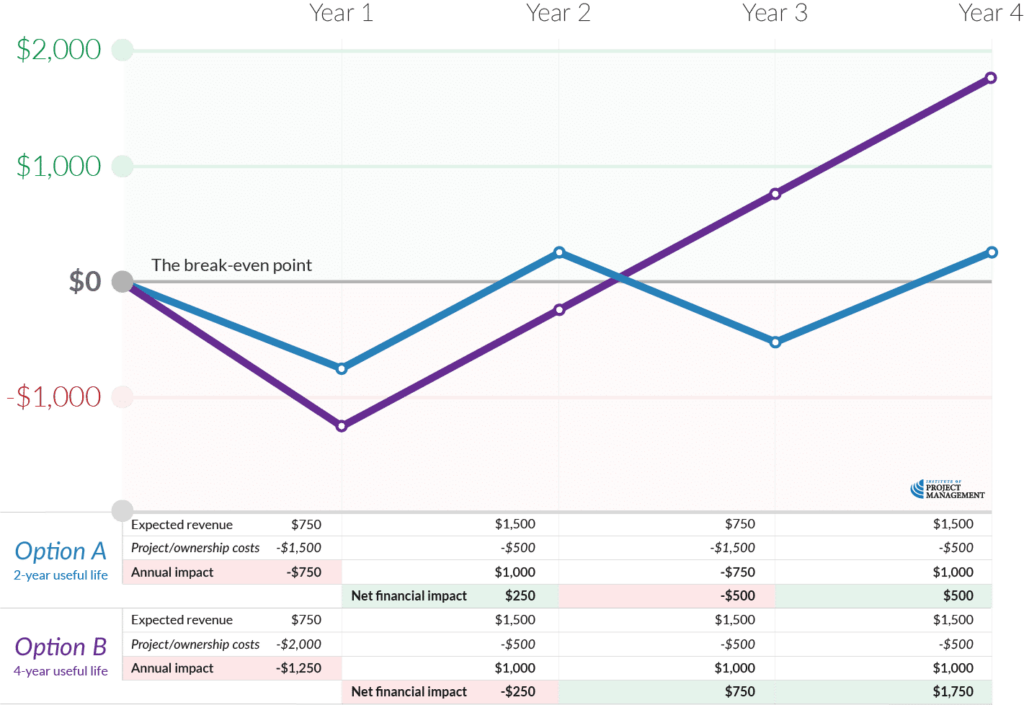
Option A is still a better two-year solution; however, over a four-year cycle, Option B would be much more preferable (by financial criteria alone).
Another important post-project milestone is the break-even point.
At this point, the project and its operations fully recover their investment costs and proceed into profitable territory.
Our example shows that even though Option A breaks even sooner (Year 2), the need to rebuild this Option every two years significantly reduces its long-term profitability versus Option B.
Real-world examples will be much more complex, but these are essential financial principles that any business analyst / project manager should know.
You might also use the following formula when evaluating net financial impact:
- Project (outcome) revenue – ownership (outcome) costs
You would use this when considering project outputs and outcomes as separate criteria for business case decision-making.
Opportunity costs
On larger, more complex projects, your finance team might also consider the theoretical opportunity cost of each option.
Opportunity costing asks, “What would we make if we re-invested all this project money in business-as-usual activities?”
For example: A city has $1 billion in the bank and decides to construct a new football stadium – these are the project costs.
It might cost the city $10 million per year over 40 years to own and operate the stadium – ownership costs another $400 million.
They also expect to make $2 billion leasing the stadium to professional sports teams and major events over that time, for a net financial impact of +$600 million ($2 billion – ($1 billion + $400 million)).
Assuming our estimates are reliable, this sounds like a good deal!
However, by investing $1 billion in the football stadium, we also lose the opportunity to leave the money in the bank and make 2% per year, compounding interest over 40 years, or a net financial profit of $2.2 billion.
In our example, the opportunity cost of building a stadium (+$2.2 billion) is greater than its projected net financial impact (+$600 million).
On this basis, we should leave the money in the bank.
Opportunity costing methods, such as the crude net present valuation shown in this example, create an effective implied option for business case analysis.
But wait!
We know that a stadium project will bring much more value to its community than the direct revenue it generates through leasing.
Sophisticated economic modeling can forecast the additional financial impacts of the downstream increase in tourism numbers, jobs created, tax revenue, and related city benefits.
This is important, as outcomes such as these align with the strategic objectives of our city planners.
Because the application of these methodologies is beyond what is expected of most project managers, you should involve relevant experts where appropriate in this regard.
And beyond that are a range of impacts that cannot be quantified in monetary terms.
After all, what price do you put on the civic pride that people get from having a professional sports team to cheer for?
For that reason, non-financial impacts may also be critical inputs into business case decision-making, and we will look at these in the next topic.
